|
|
|
Stock Market Prediction
with Neural Networks
Team Members
Jeffrey R. Byrne
Morgan T. Savage
The main idea of this
project is to predict the stock market on a small scale. Only twenty stocks are
predicted. The stocks chosen are in five different categories so the results can
be compared. We are also looking for stocks that have dissimilar volumes and
prices.
The data was collected using the Internet site http://finance.yahoo.com.
Yahoo has an option of saving data in a comma separated value (.csv) format
that works with many spreadsheets. The .csv files were loaded into Excel and
then sorted by date so they were easier to use. The data includes the dat,
opening value, high value, low value, closing value, and volume (index and
composite stocks do not have a volume).
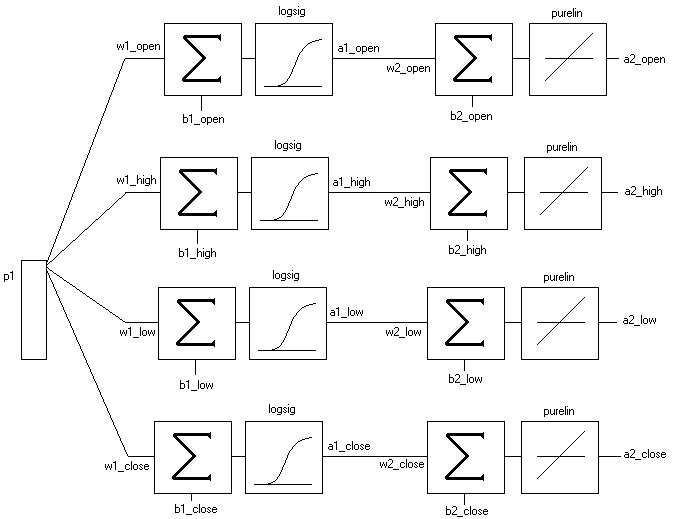
With the network we made two
predictions. In the long-term prediction we predict the next day's closing value
and then use that value to predict the day after that. In the one-day prediction
we predict one day into the future using the data from the days before the
predicted day.
Our program outputs a .csv file so the results can be used in a spreadsheet program. The input is read in from standard in and the output is printed to standard out. The status is printed to standard error. So if you wanted to run the program it would look something like this. On a 900 MHz AMD Athlon it takes about 5 hours to predict one stock.
nn < stock.csv > stock.out.csv
The program compiles using the GNU C++
compiler it doesn't compile with the Sun compiler. The included matrix functions were download from Jun
Hong's website. We would
like to thank him for providing these functions it saved us a lot of time.
If
you would like to try the program all the source files needed to compile it are
included below.
nn.cpp
matrix.h
field.h
field_traits.h
Index/Composite
Dow Jones Industrial Average (^dji)
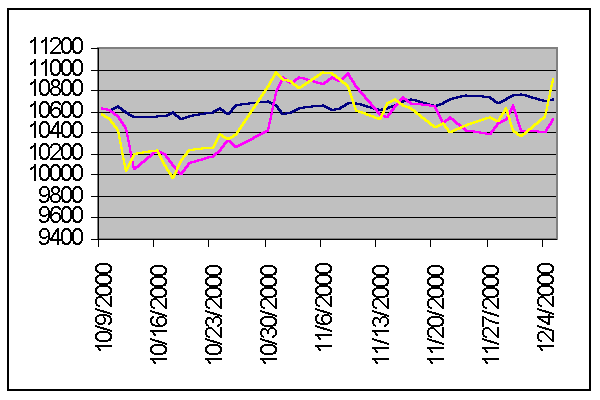
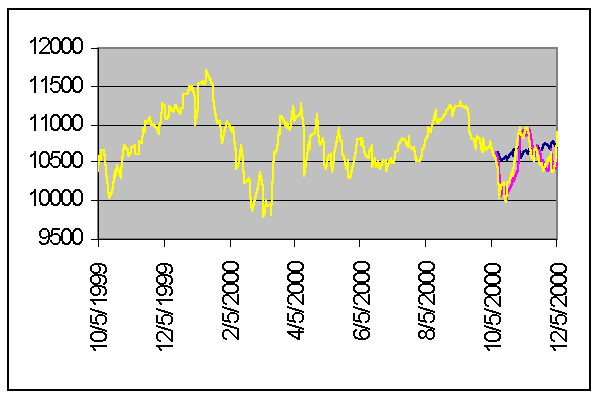
Long Term Prediction Average Square Error: 77113.93825
One Day Prediction Average Square Error: 24576.38176
Data: dji.csv dji.out.csv
Nasdaq Composite (^ixic)
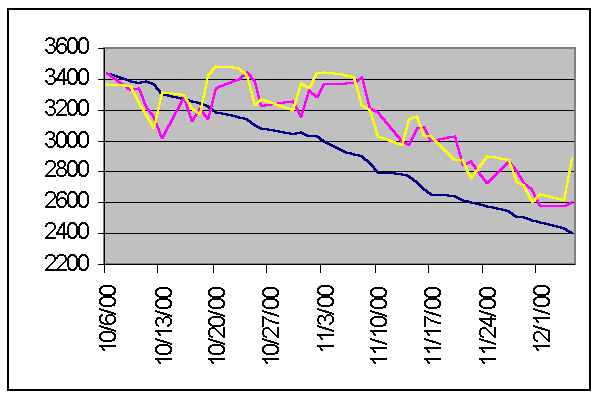
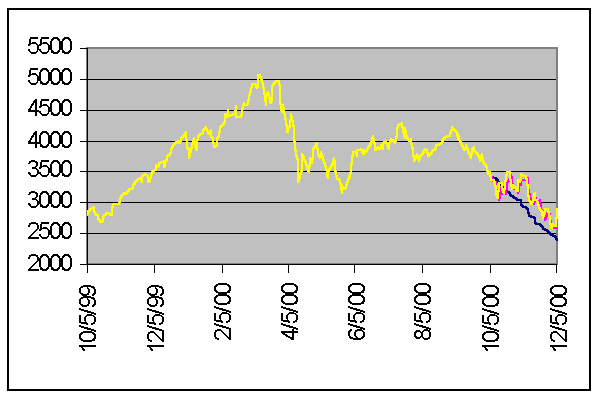
Long Term Prediction Average Square Error: 80316.62018
One Day Prediction Average Square Error: 14755.98632
Data: ixic.csv ixic.out.csv
NYSE Composite (^nya)
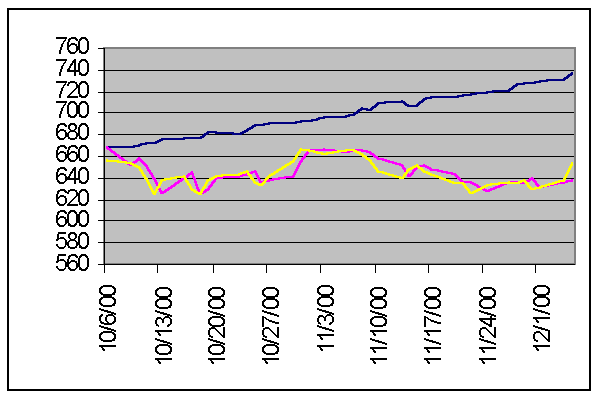
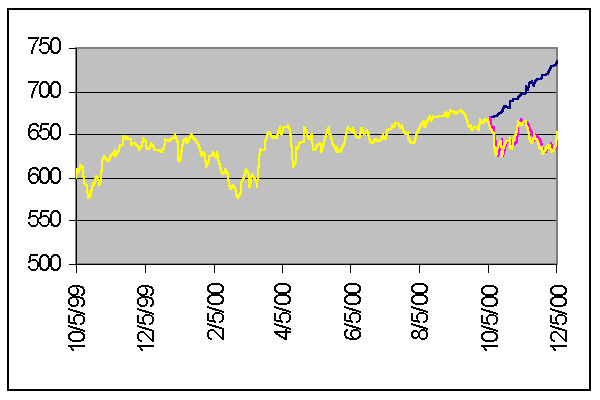
Long Term Prediction Average Square Error: 3559.086323
One Day Prediction Average Square Error: 61.69185991
Data: nya.csv nya.out.csv
S&P 500 Index (^spc)
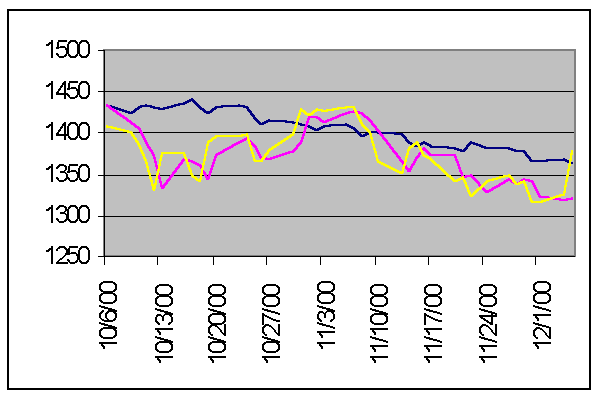
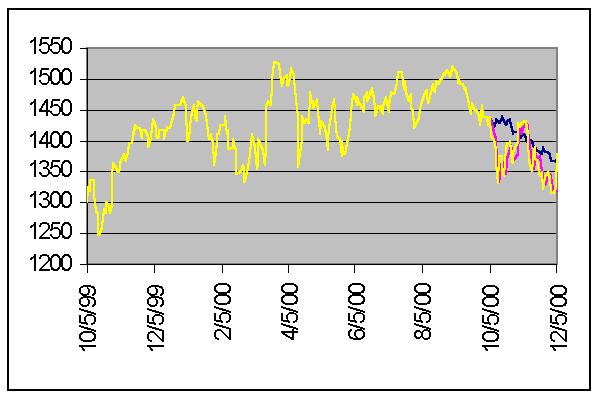
Long Term Prediction Average Square Error: 1896.018034
One Day Prediction Average Square Error: 495.8267597
Data: spc.csv spc.out.csv
Automotive
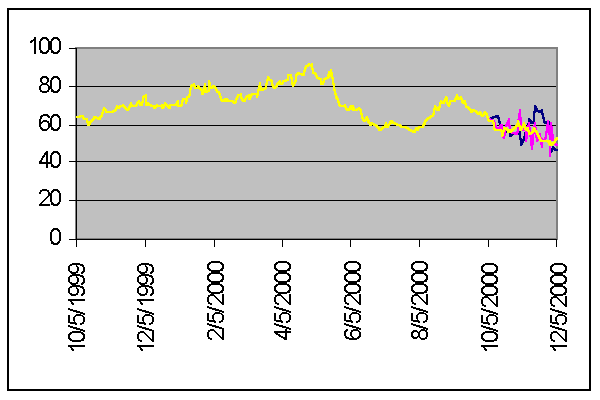
DaimlerChrysler (dcx)
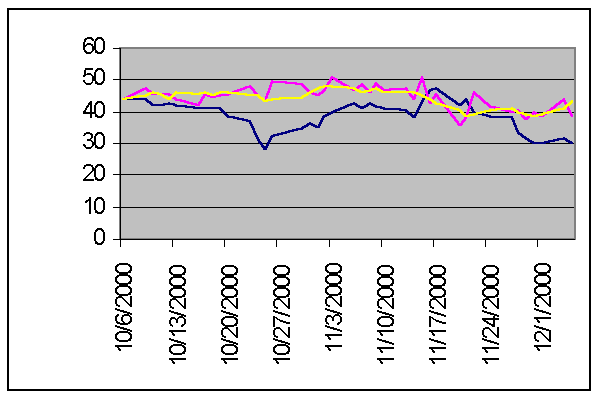
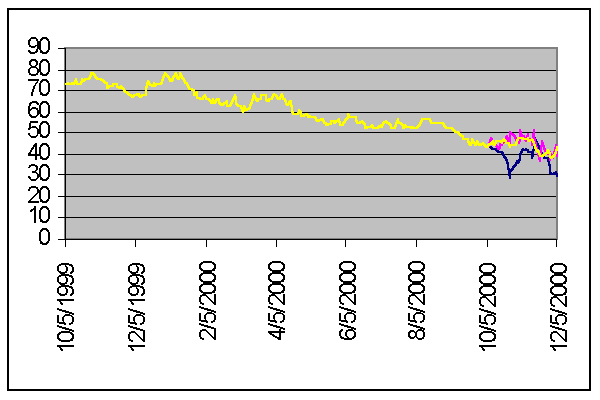
Long Term Prediction Average Square Error: 51.65527836
One Day Prediction Average Square
Error: 6.592816055
Data: dcx.csv dcx.out.csv
General Motors (gm)
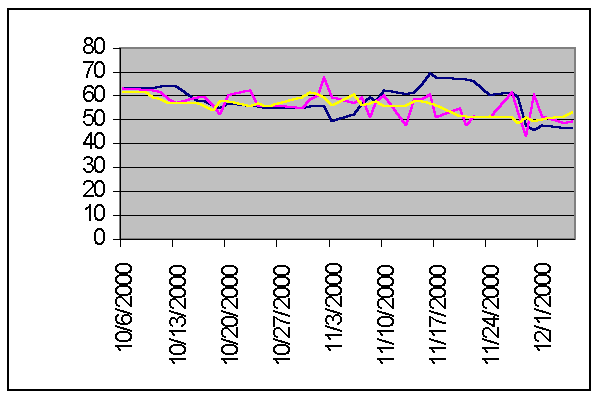
Long Term Prediction Average Square Error: 47.93595844
One Day Prediction Average Square Error: 19.83823451
Data: gm.csv gm.out.csv
Honda (hmc)
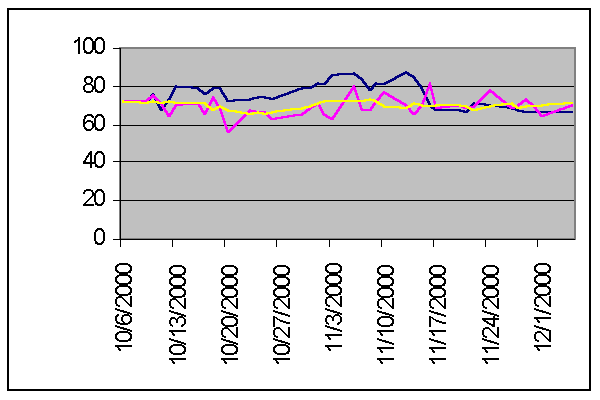
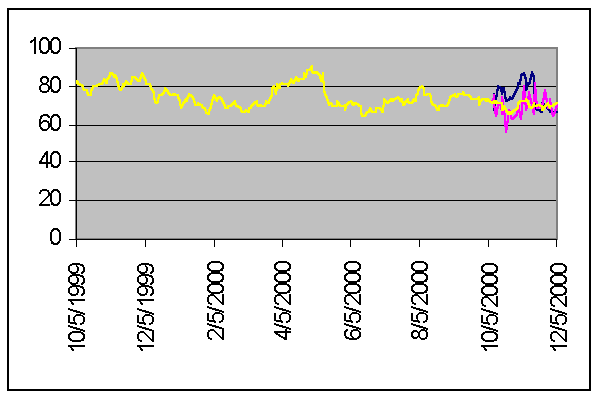
Long Term Prediction Average Square Error: 61.51245685
One Day Prediction Average Square Error: 23.37233057
Data: hmc.csv hmc.out.csv
Toyota (tm)
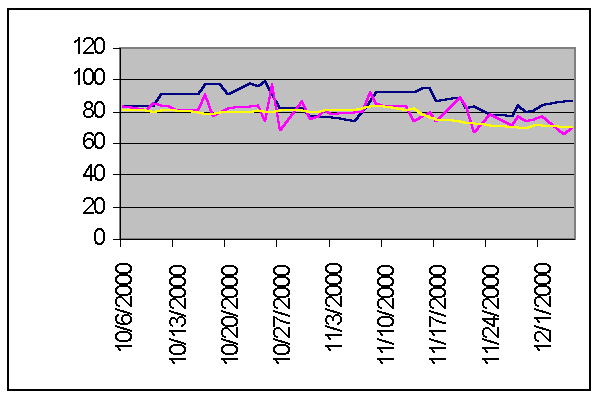
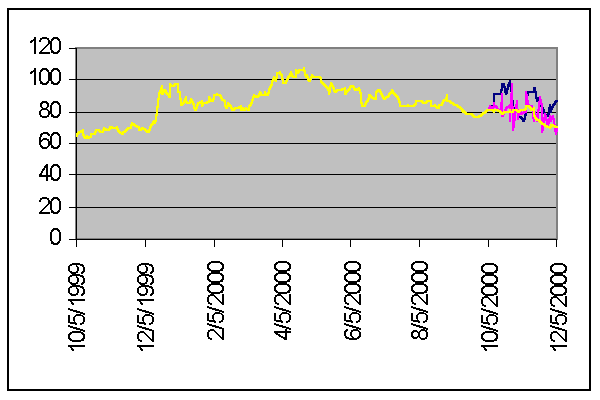
Long Term Prediction Average Square Error: 126.3612737
One Day Prediction Average Square Error: 36.99400286
Data: tm.csv tm.out.csv
Restaurants
McDonalds (mcd)
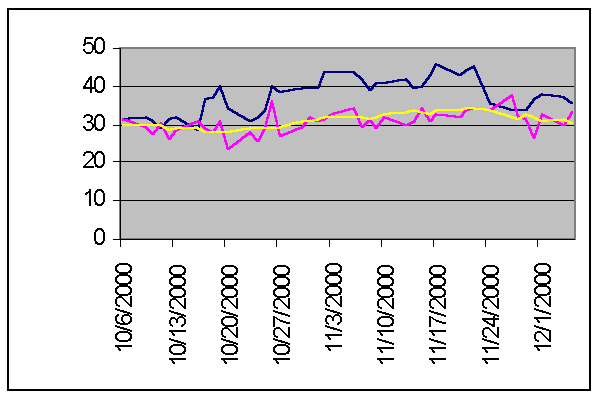
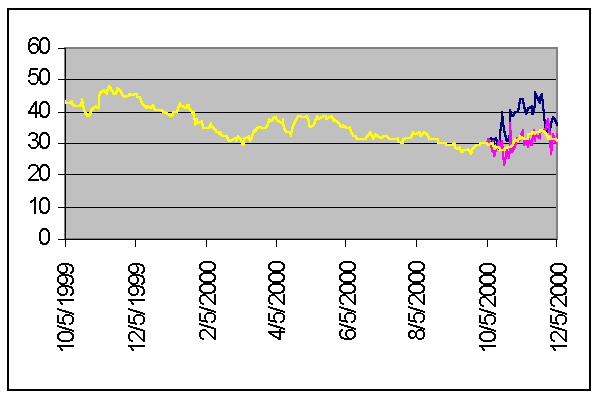
Long Term Prediction Average Square Error: 58.78749784
One Day Prediction Average Square Error: 5.786291666
Data: mcd.csv mcd.out.csv
Papa John's (pzza)
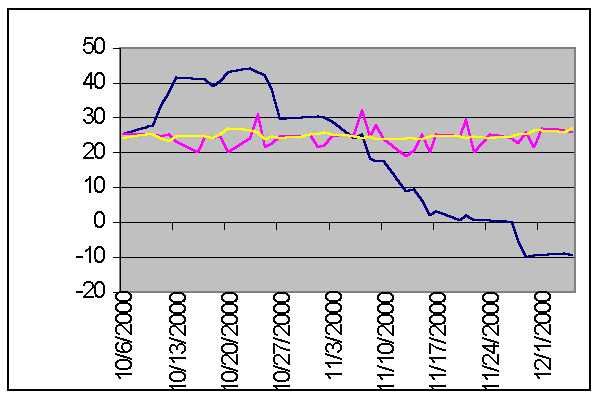
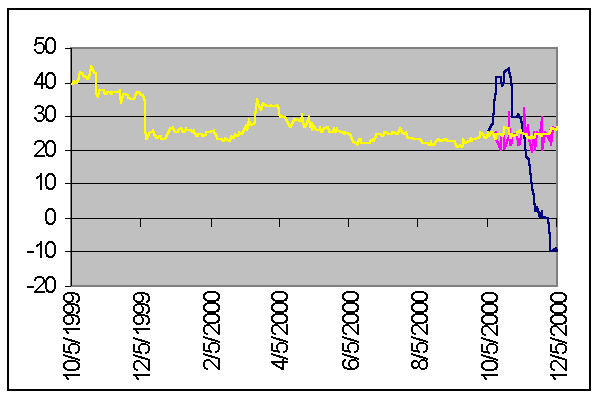
Long Term Prediction Average Square Error: 359.7499594
One Day Prediction Average Square Error: 8.587007644
Data: pzza.csv pzza.out.csv
Tricon Global (yum)
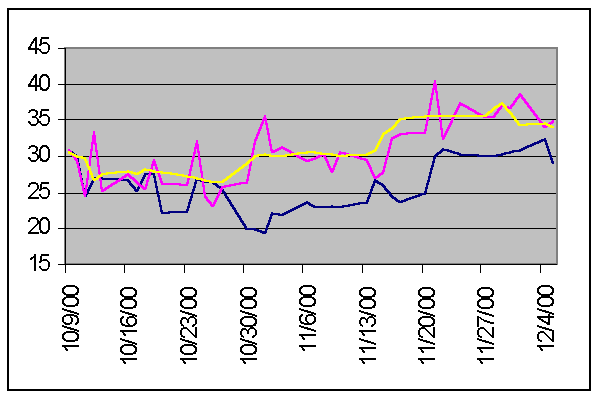
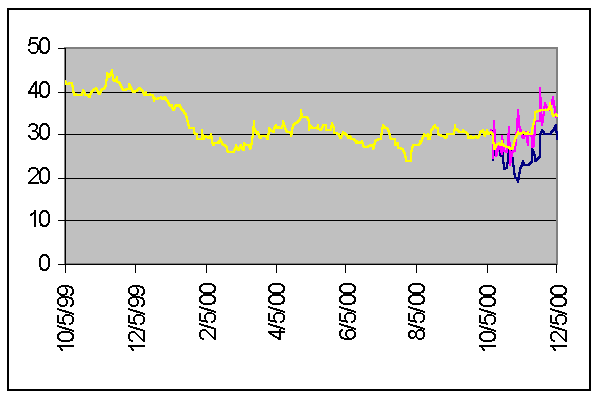
Long Term Prediction Average Square Error: 36.94000251
One Day Prediction Average Square Error: 7.413515185
Data: yum.csv yum.out.csv
Wendy's (wen)
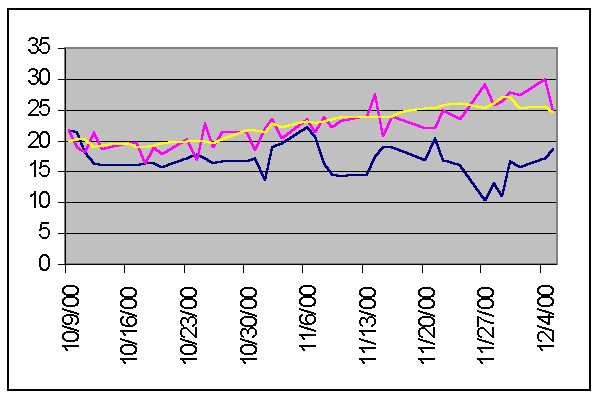

Long Term Prediction Average Square Error: 45.39595126
One Day Prediction Average Square Error: 3.804009433
Data: wen.csv wen.out.csv
Retail Stores
Best Buy (bby)
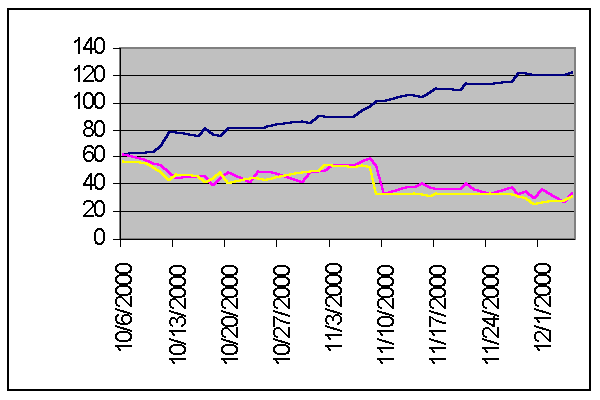
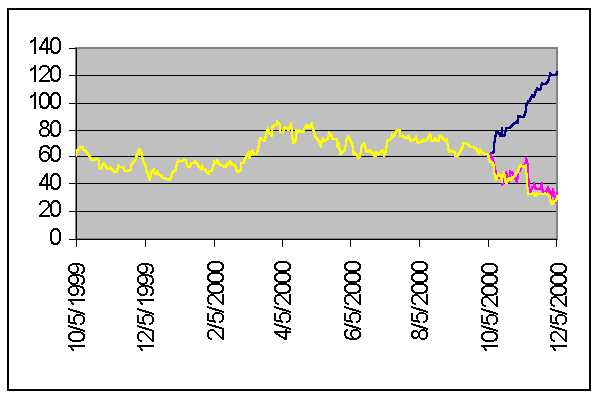
Long Term Prediction Average Square Error: 3566.824876
One Day Prediction Average Square
Error: 32.48430718
Data: bby.csv bby.out.csv
Circuit City (cc)
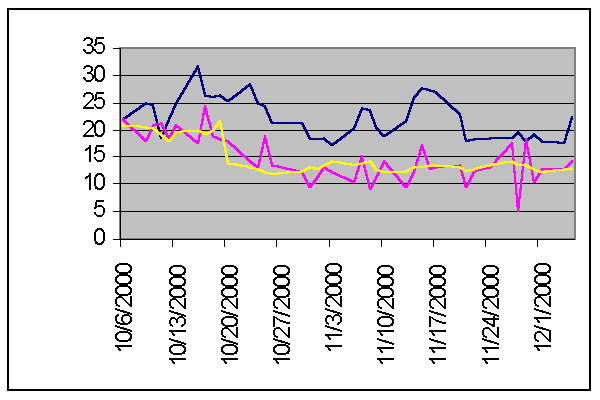
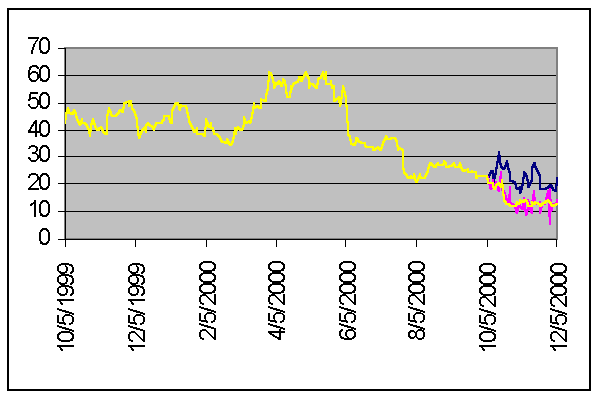
Long Term Prediction Average Square Error: 70.12529408
One Day Prediction Average Square
Error: 8.159903371
Data: cc.csv cc.out.csv
RadioShack (rsh)
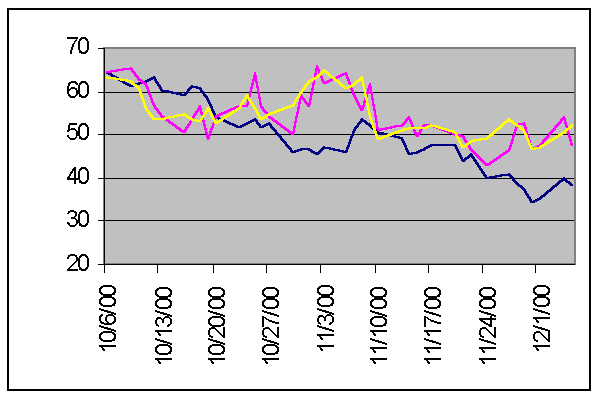
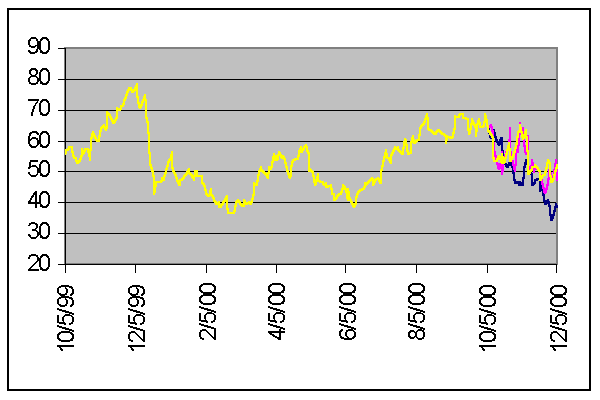
Long Term Prediction Average Square Error: 80.32533625
One Day Prediction Average Square Error: 14.53702938
Data: rsh.csv rsh.out.csv
Sears (s)
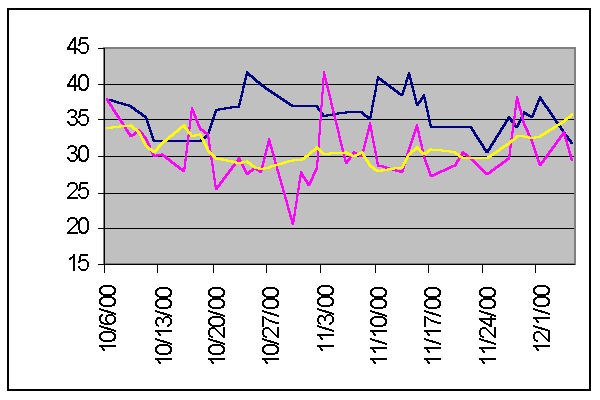
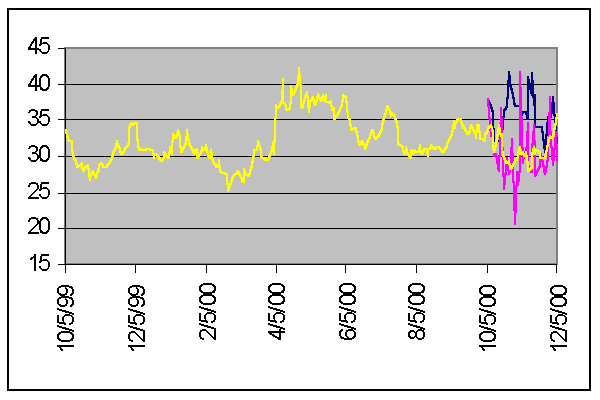
Long Term Prediction Average Square Error: 40.97085947
One Day Prediction Average Square Error: 12.56551261
Data: s.csv s.out.csv
Technology Companies
Cisco Systems (csco)
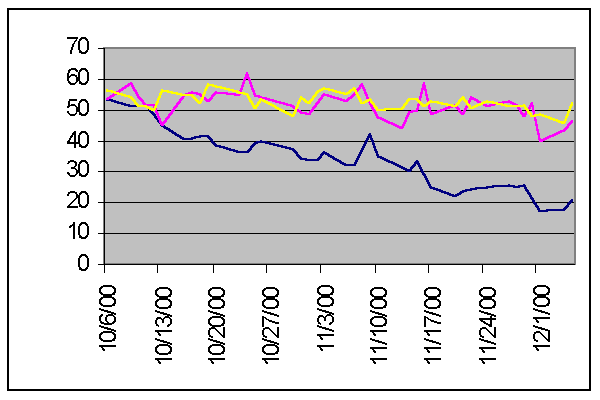
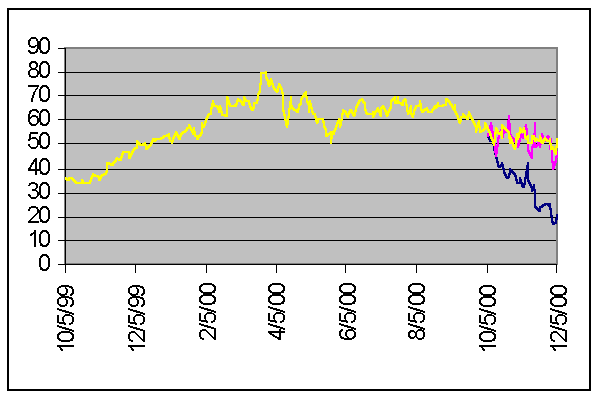
Long Term Prediction Average Square Error: 415.9482052
One Day Prediction Average Square Error: 17.39387318
Data: csco.csv csco.out.csv
Juniper Networks (jnpr)
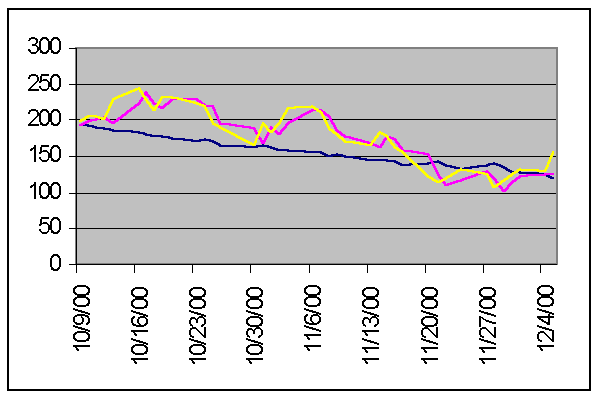
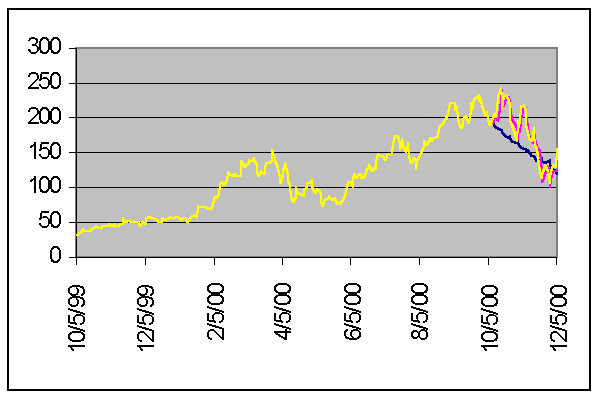
Long Term Prediction Average Square Error: 1152.58902
One Day Prediction Average Square Error: 215.2177402
Data: jnpr.csv jnpr.out.csv
Lucent Technologies (lu)
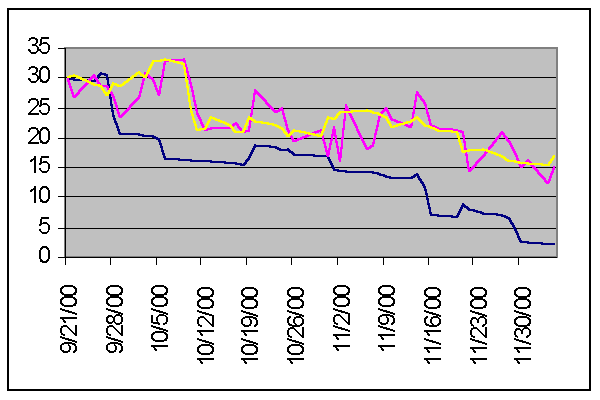
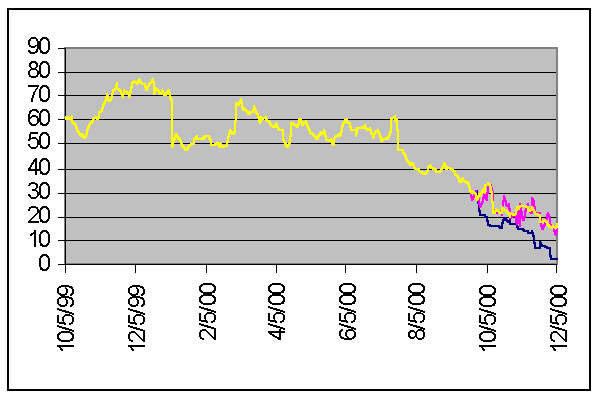
Long Term Prediction Average Square Error: 88.64824797
One Day Prediction Average Square Error: 9.549178934
Data: lu.csv lu.out.csv
Nortel Networks (nt)
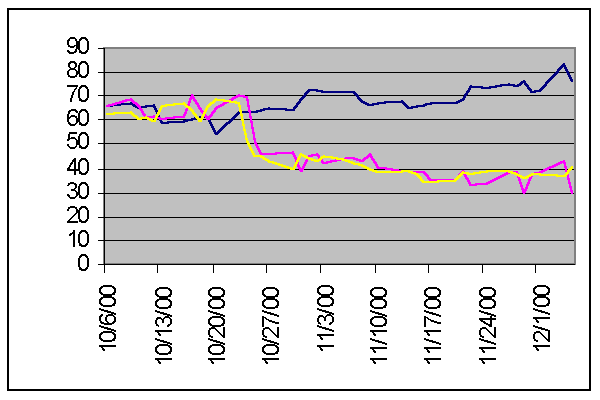
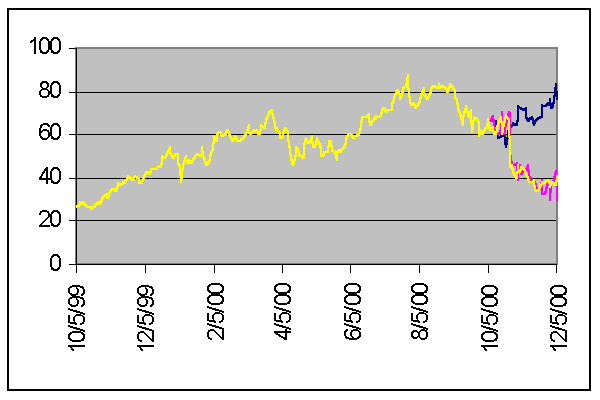
Long Term Prediction Average Square Error:
671.9034343
One Day Prediction Average Square Error: 25.65661239
Data: nt.csv nt.out.csv
Legend for all graphs

The results were did not come
out as well as we hoped. Some of the predictions like the Nortel Networks were
reasonable others like Papa Johns were far off. We found our original network
that only predicted on the closing price had a very linear prediction.
First we tried increasing the amount of days we were prediction from but this
seemed to make the graph more linear in some cases or more erratic in others.
When we added the one-day prediction to our original network the graph
looked like an offset time delayed closing price graph. Not understanding
exactly what was going on we added the open, high, and low prediction. The
results shown above are from those predictions. Not liking some of our new
predictions we tried our old program but this time with more training. We
didn't have time to run the program on all stocks so we only ran it Papa John's
that are prediction look bad.
Papa John's (pzza)
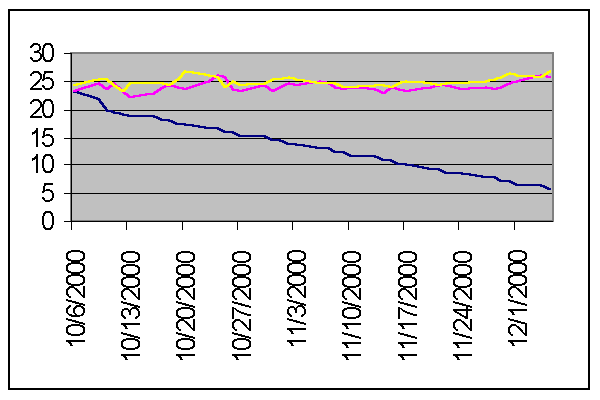
We found it hard to decide how much to train the network. The number of stocks we choose and the time it took to train the neural network made this hard. At the end we couldn't decide on how much data to predict on. The extra data added to the training.
Other things we would have liked to try several other things. The data included the volume and it never used. Finding the day of week and assigning it a number value would have also added to the data. Changing the way the high, low, and open are predicted might help because there are cases where the predicted low was higher than the predicted high. Having more CPU power would have been helpful when designing the network.